filename = '01-daten/TC01.csv'
data = np.loadtxt(filename)7 Reading and Writing Files
The numpy module provides functions for reading and writing structured text files.
7.1 Reading Files
To read structured text files, such as CSV (comma-separated values) files, the np.loadtxt() function can be used. It takes the filename to be read as its main argument, along with other options to define the data structure. The return value is a (multi-dimensional) array.
In the following example, the file TC01.csv is read and its contents are plotted. The first line of the file is ignored, as it is interpreted as a comment (starting with the # character).
print("Data:", data)
print("Shape:", data.shape)
Data: [20.1 20.1 20.1 ... 24.3 24.2 24.2]
Shape: (1513,)plt.plot(data)
plt.xlabel('Data Index')
plt.ylabel('Temperature in °C');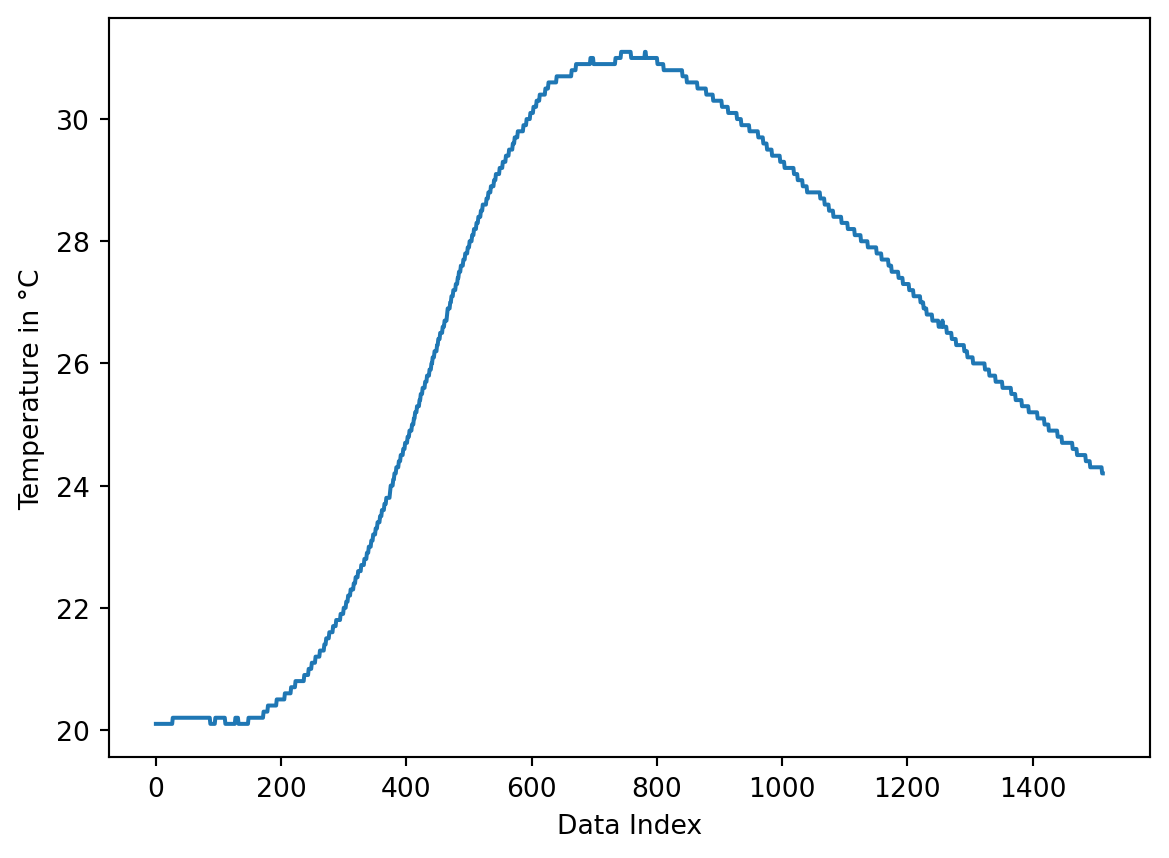
By default, the np.loadtxt() function expects comma-separated values. If the data is separated by a different character, the delimiter = "" option can be used to specify a different delimiter. For example, if the separator is a semicolon, the function call would look like: np.loadtxt(data.txt, delimiter = ";")
If the file starts with lines containing additional information such as units or experiment details, these can be skipped using the skiprows= #rows option.
7.2 Writing Files
To write arrays to files, you can use the np.savetxt() function available in numpy. At a minimum, it requires the array to be written and a filename. Numerous formatting and structuring options are also available.
The following example scales the data read earlier and writes every tenth value to a new file. A comment (header argument) is also added at the beginning of the file. The output format of the numbers can be specified using the fmt argument. The format is similar to the formatting style used in formatted strings.
value_range = np.max(data) - np.min(data)
data_scaled = (data - np.min(data)) / value_range
data_scaled = data_scaled[::10]
plt.plot(data_scaled)
plt.xlabel('Data Index')
plt.ylabel('Scaled Temperature');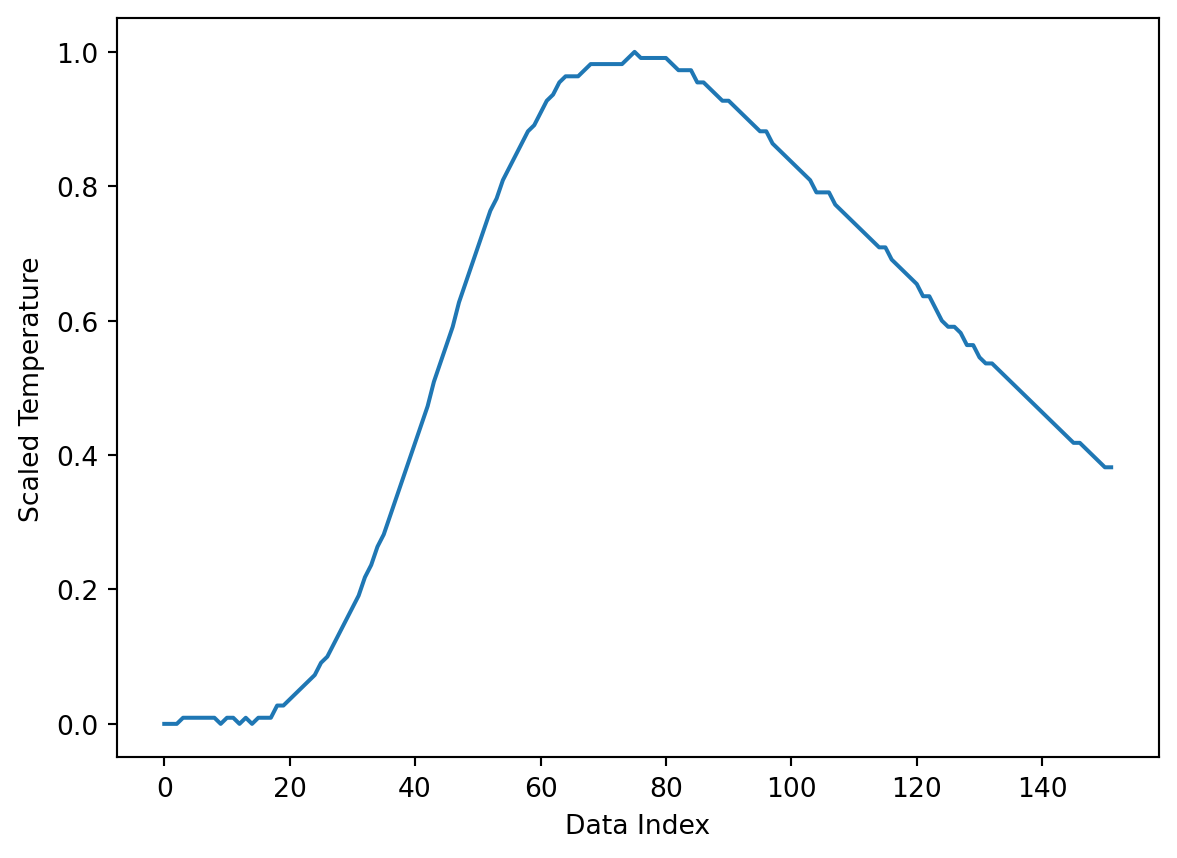
When writing the file, a multi-line comment is defined using the newline character \n. The floating-point numbers are formatted with %5.2f, which means 5 total characters with 2 digits after the decimal point.
# Assignment is split into multiple lines due to the narrow display in the script
comment = f'Data from {filename} scaled to the range ' + \
           '0 to 1 \noriginal min / max: ' + \
           f'{np.min(data)}/{np.max(data)}'
new_filename = '01-daten/TC01_scaled.csv'

np.savetxt(new_filename, data_scaled,
           header=comment, fmt='%5.2f')
To illustrate, the first lines of the newly created file are printed.
# Read the first lines of the newly created file
file = open(new_filename, 'r')
for i in range(10):
    print(file.readline(), end='')
file.close()
# Data from 01-daten/TC01.csv scaled to the range 0 to 1
# original min / max: 20.1/31.1
0.00
0.00
0.00
0.01
0.01
0.01
0.01
0.01