Dichtekurven und Normalverteilung
2026-03-19
Funktion plotten mit geom_function()
Beispiel 1
f1 <- function(x) x^2
ggplot() +
  geom_function(fun = f1)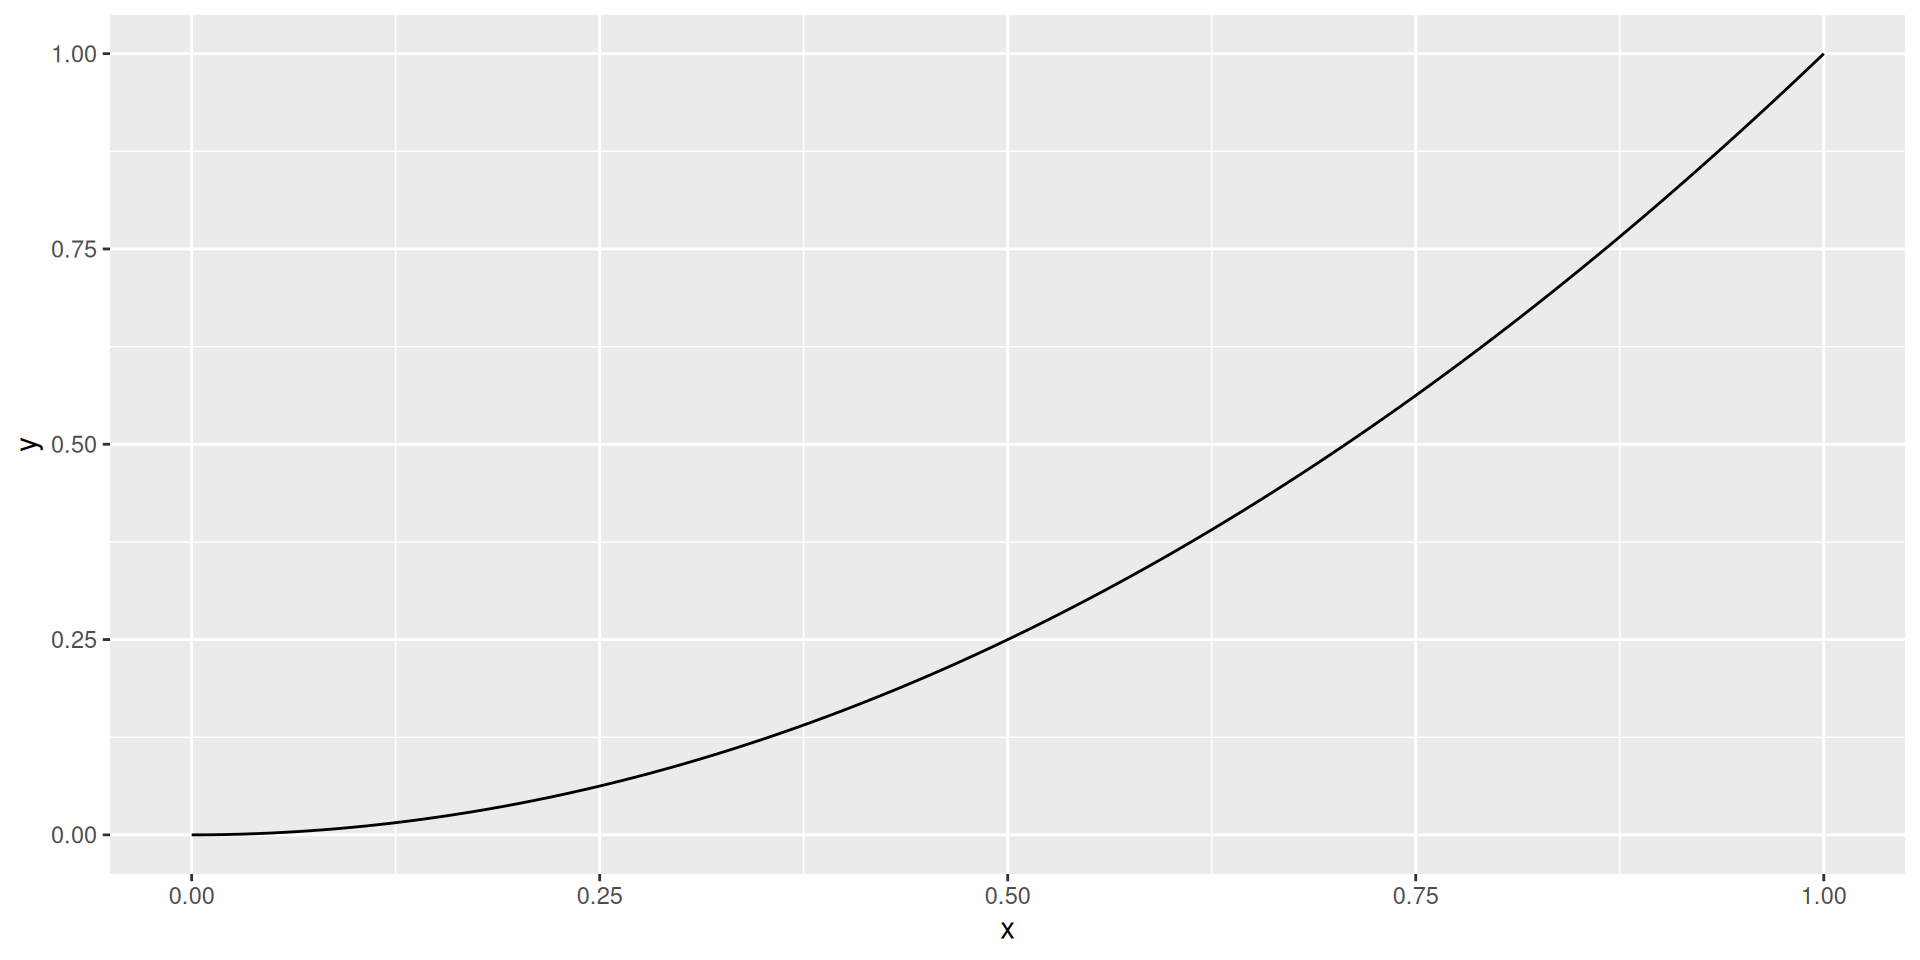
Beispiel 2
f2 <- function(x) dnorm(x, mean = 1, sd = 2)
ggplot() +
  geom_function(fun = f2)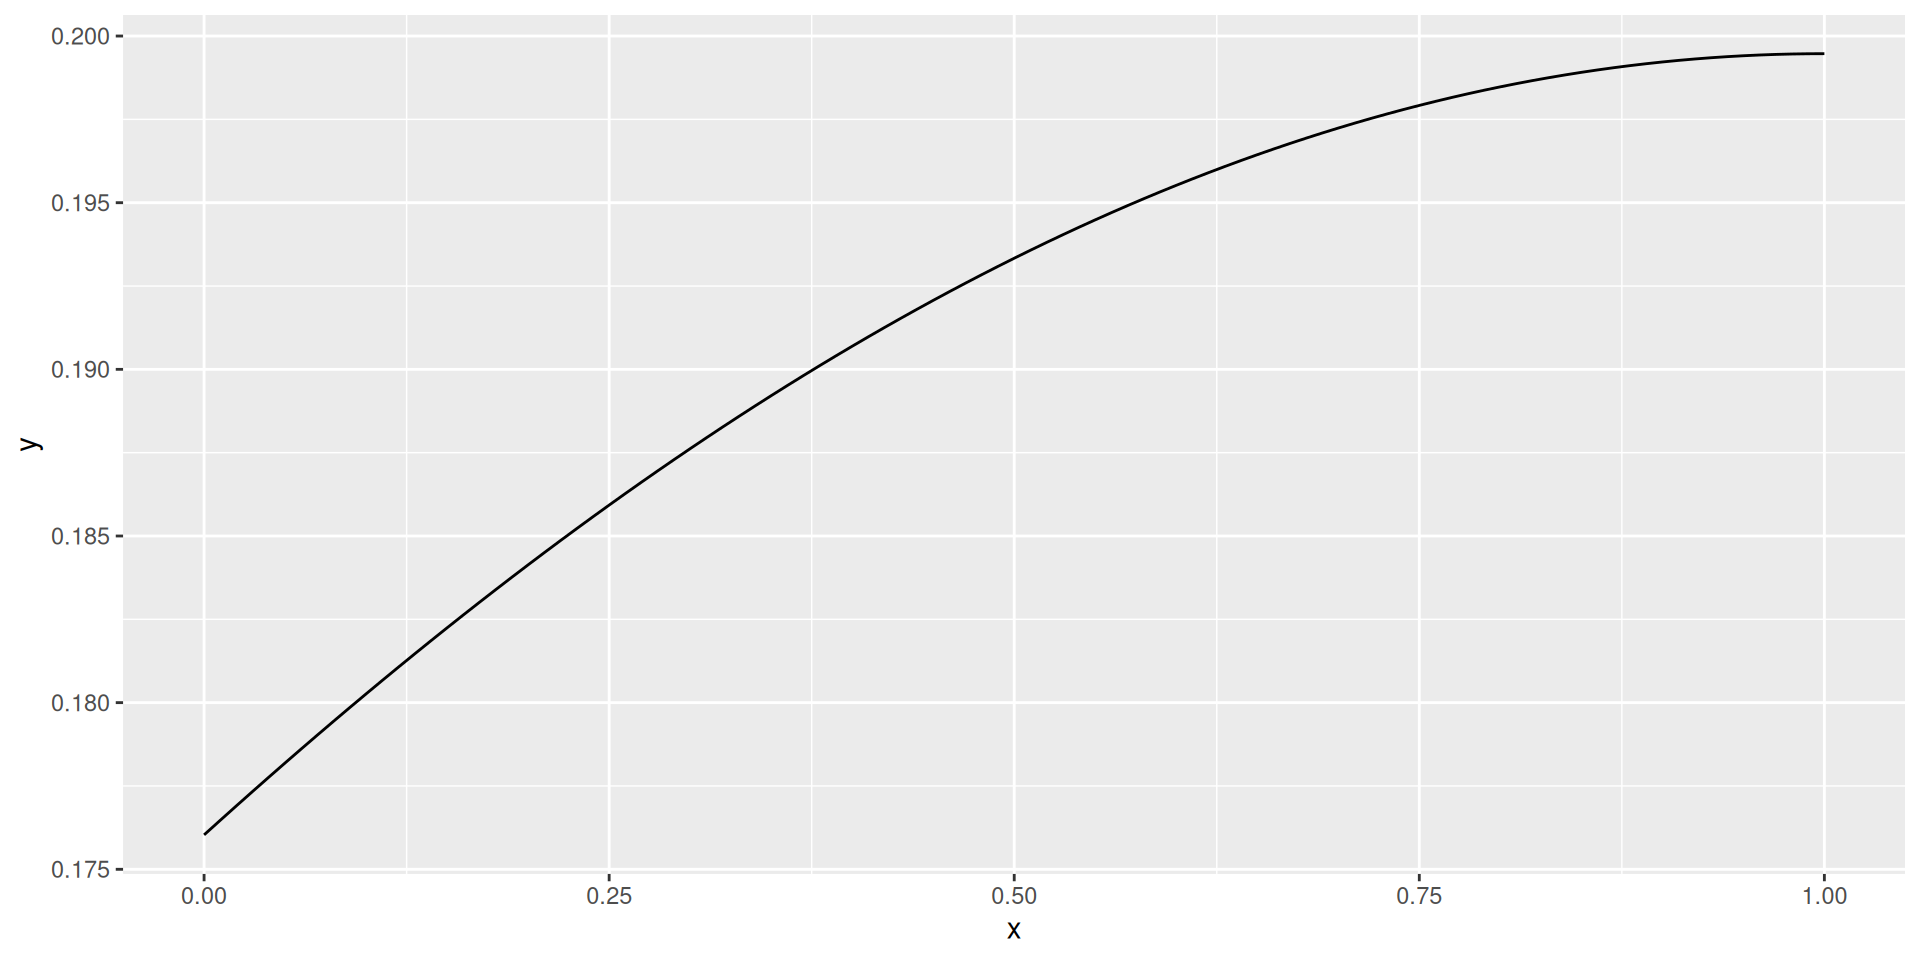
geom_function()plottet Kurve ohne Mapping- Funktion angeben mit
fun = <Funktion>
→ Plotbereich nicht gut gewählt
Plotbereich festlegen 1/2
ggplot(data = tibble(A = c(-8, -1, 1, 3, 10), B = f2(A))) +
  geom_function(fun = f2) +
  geom_point(mapping = aes(x = A, y = B))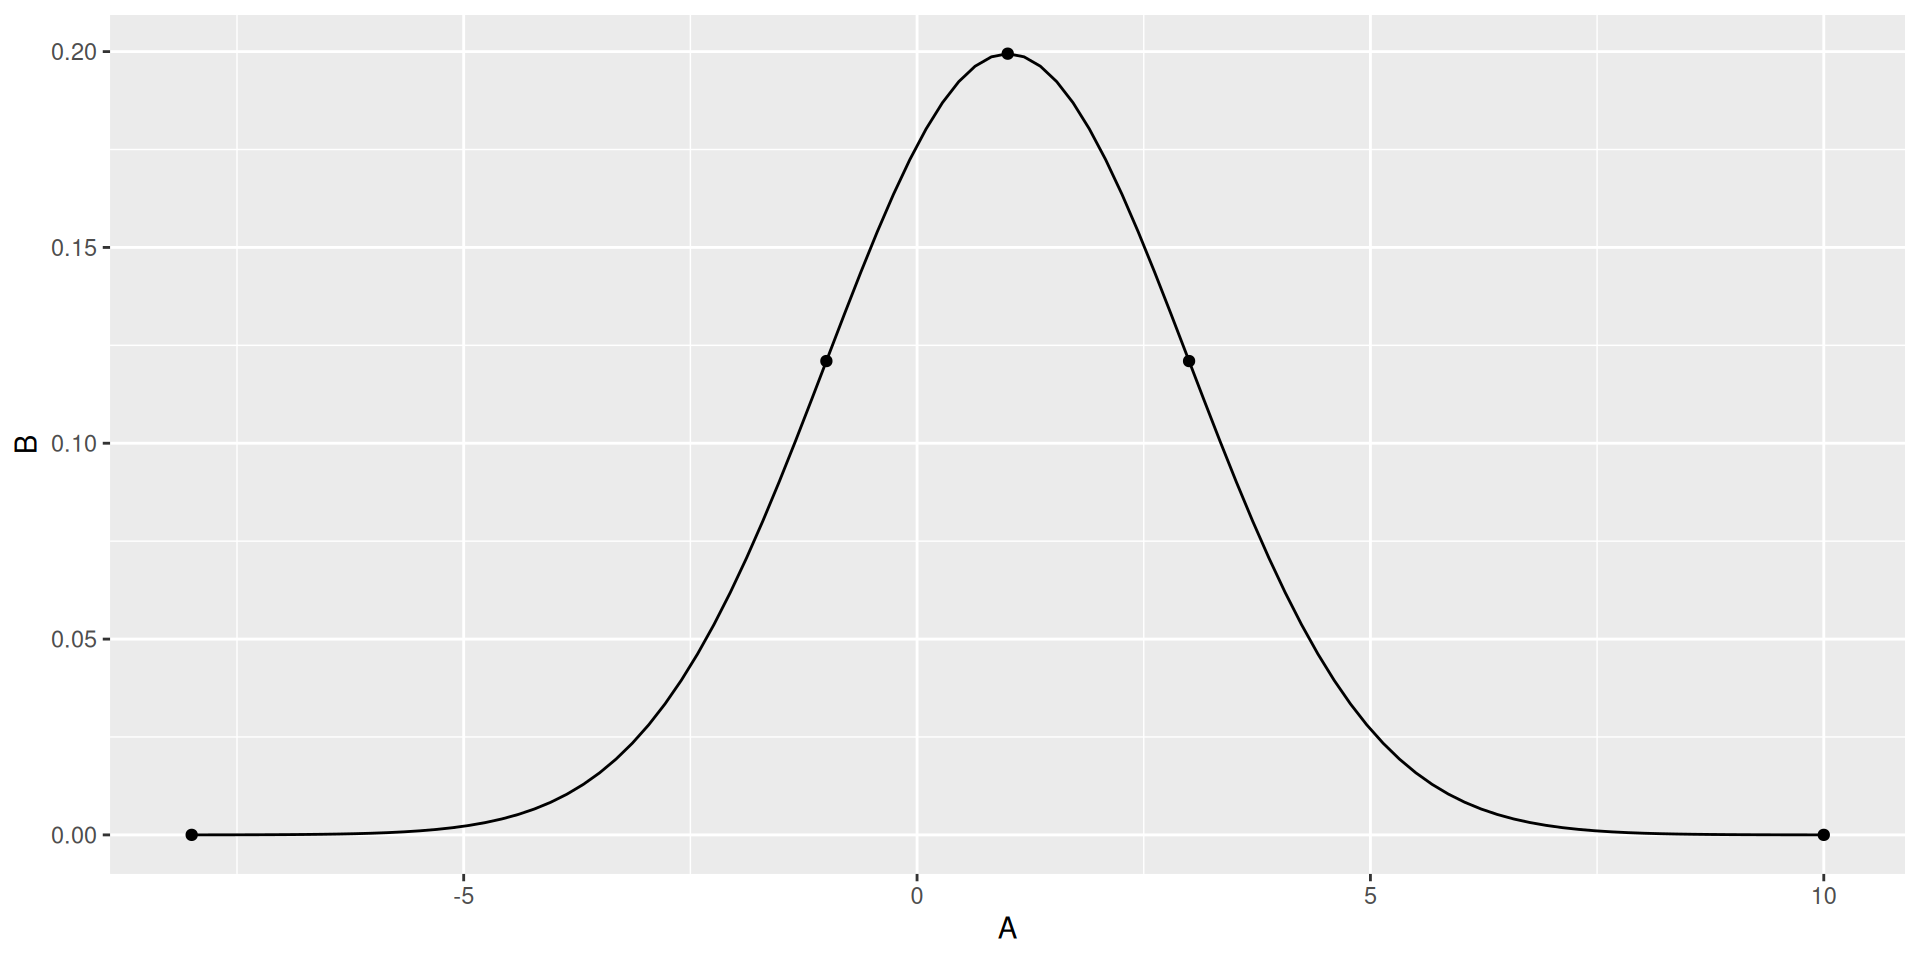
- Plotbereich aus Daten zu zweitem Geom (zum Beispiel Punkte)
Plotbereich festlegen 2/2
ggplot() +
  geom_function(fun = f2) +
  lims(x = c(-8, 10))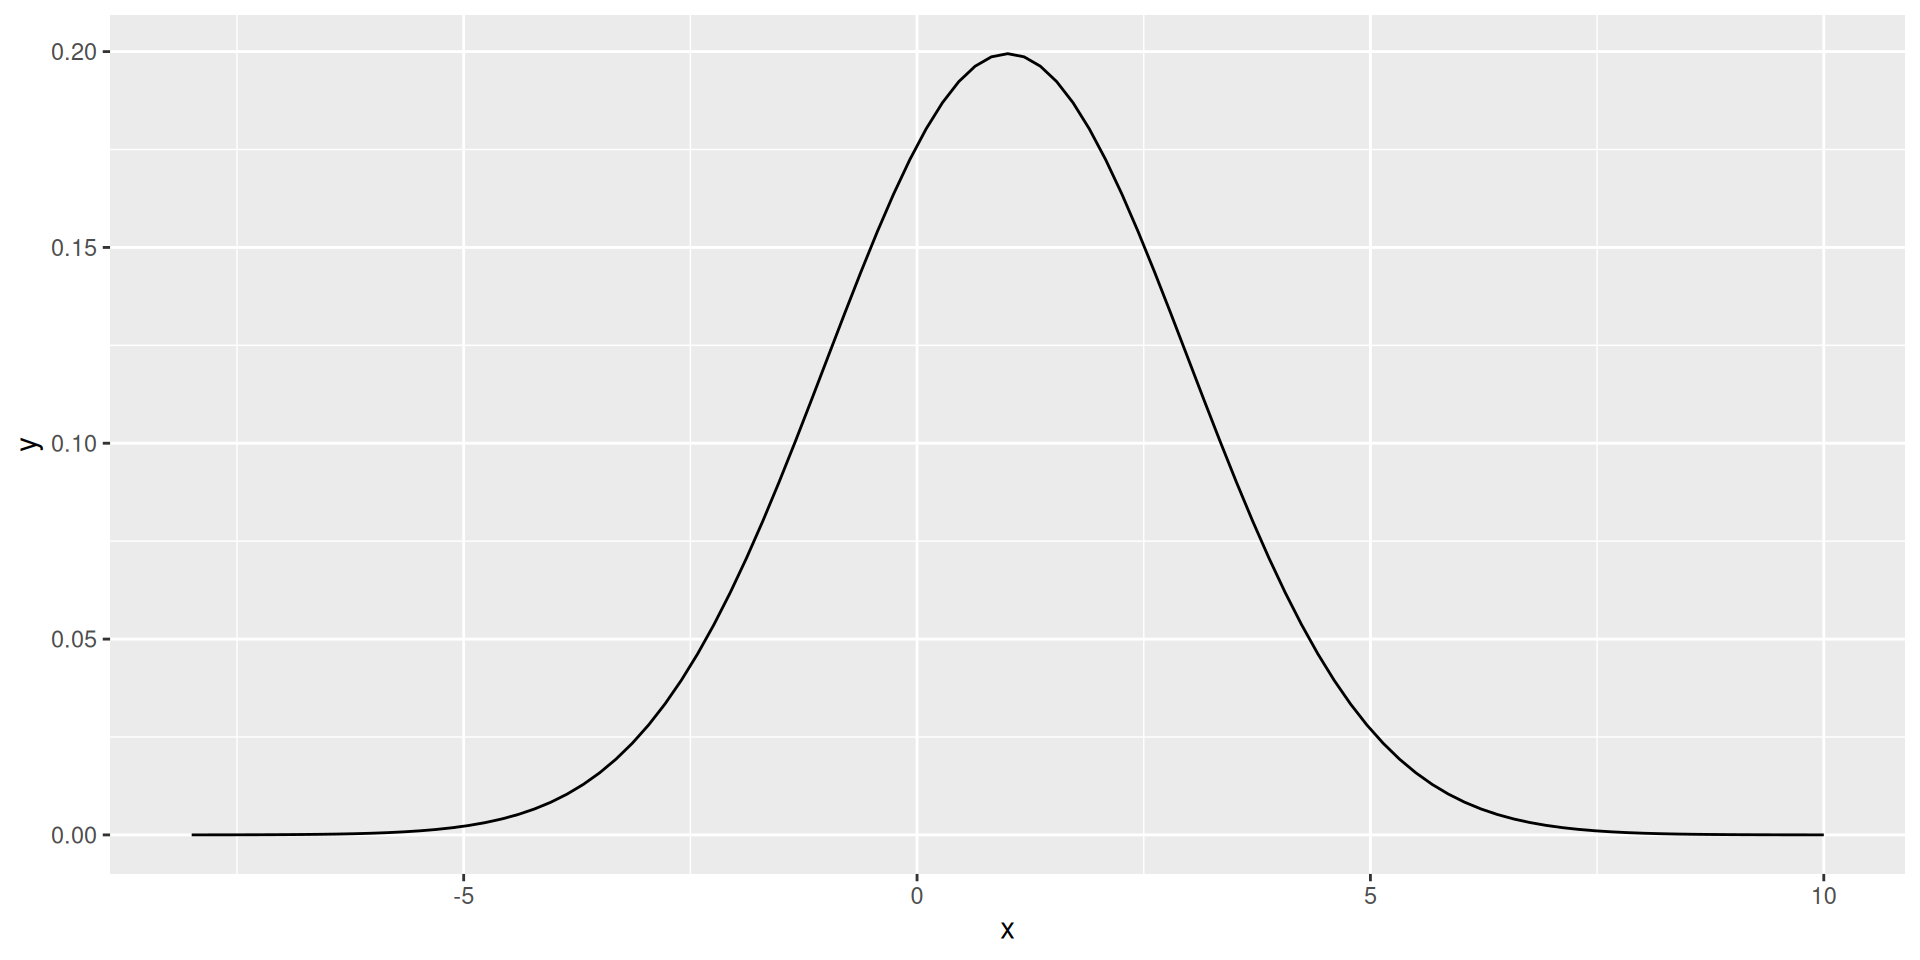
- Bereich mit
lims(x = c(xmin, xmax))explizit angeben
Funktion plotten mit geom_ribbon()
ggplot() +
  geom_ribbon(
    fun = f2, stat = "function",
    mapping = aes(x = after_stat(x), ymin = 0, ymax = after_stat(y)),
    color = "black", fill = "linen", alpha = 0.5
  ) +
  lims(x = c(-8, 10))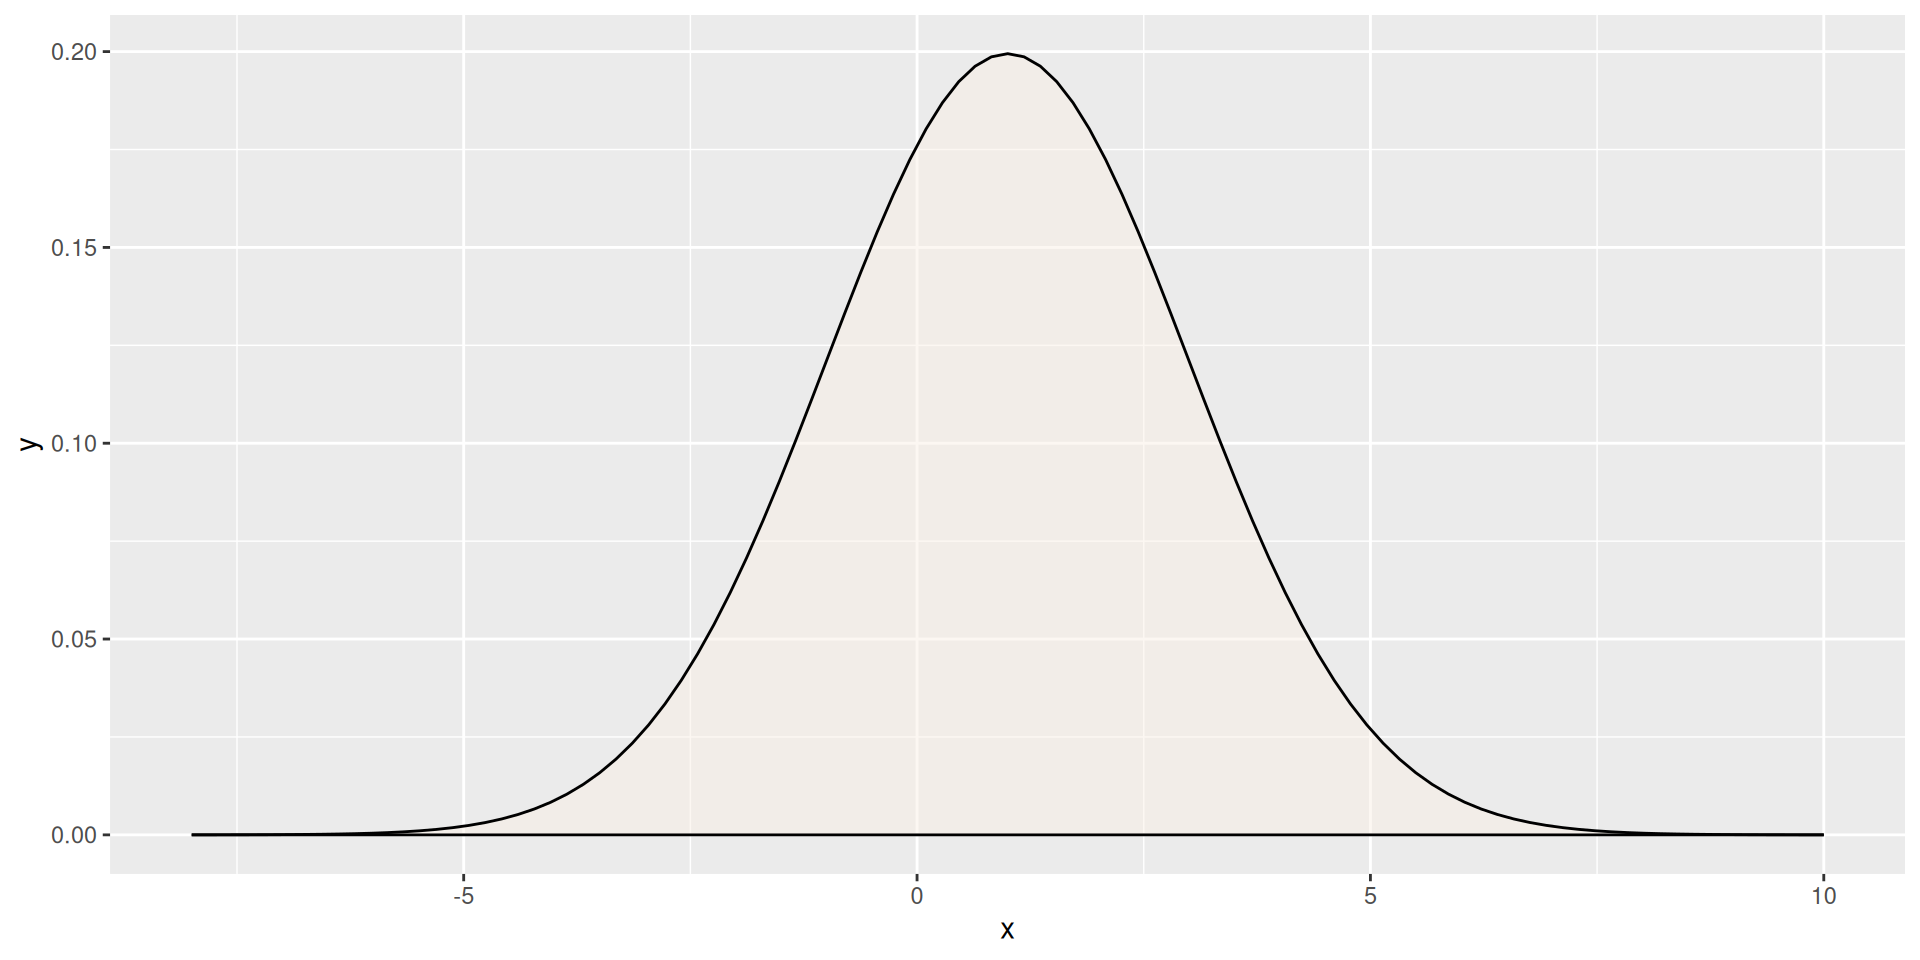
- Mit
stat = "function"Funktion plotten - Mapping mit
xundyausafter_stat(x)undafter_stat(y)
Histogramm mit Normalverteilung Niederschläge 2/2
ggplot(data = d_ns_m) +
  geom_histogram(mapping = aes(x = Niederschlag, y = after_stat(density)), binwidth = 10, boundary = 0) +
  geom_function(fun = f, color = "red", linewidth = 1)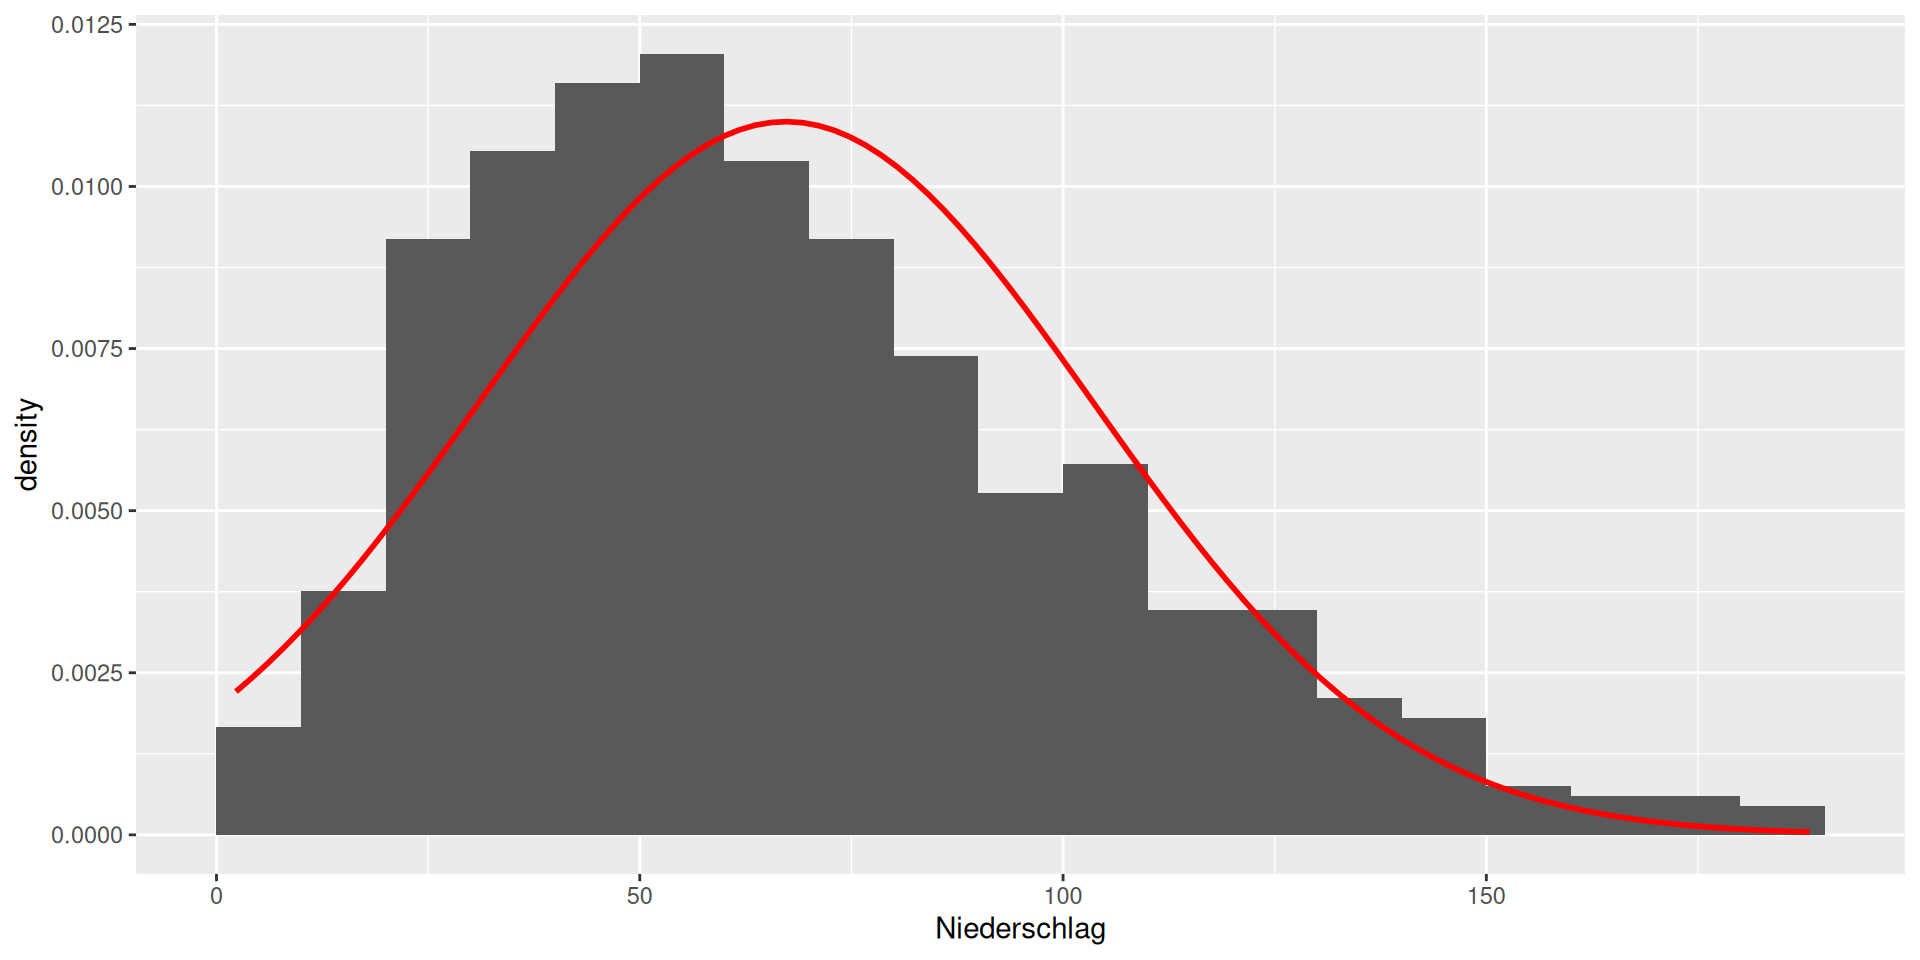
- Angaben zu Histogramm wie gehabt
- Funktion
fvorher erzeugt (vorherige Folie)
Kontrolle: Normal-Quantil-Plot
ggplot(data = d_ns_m, mapping = aes(sample = Niederschlag)) +
  geom_qq_line(color = "red", linewidth = 1) +
  geom_qq()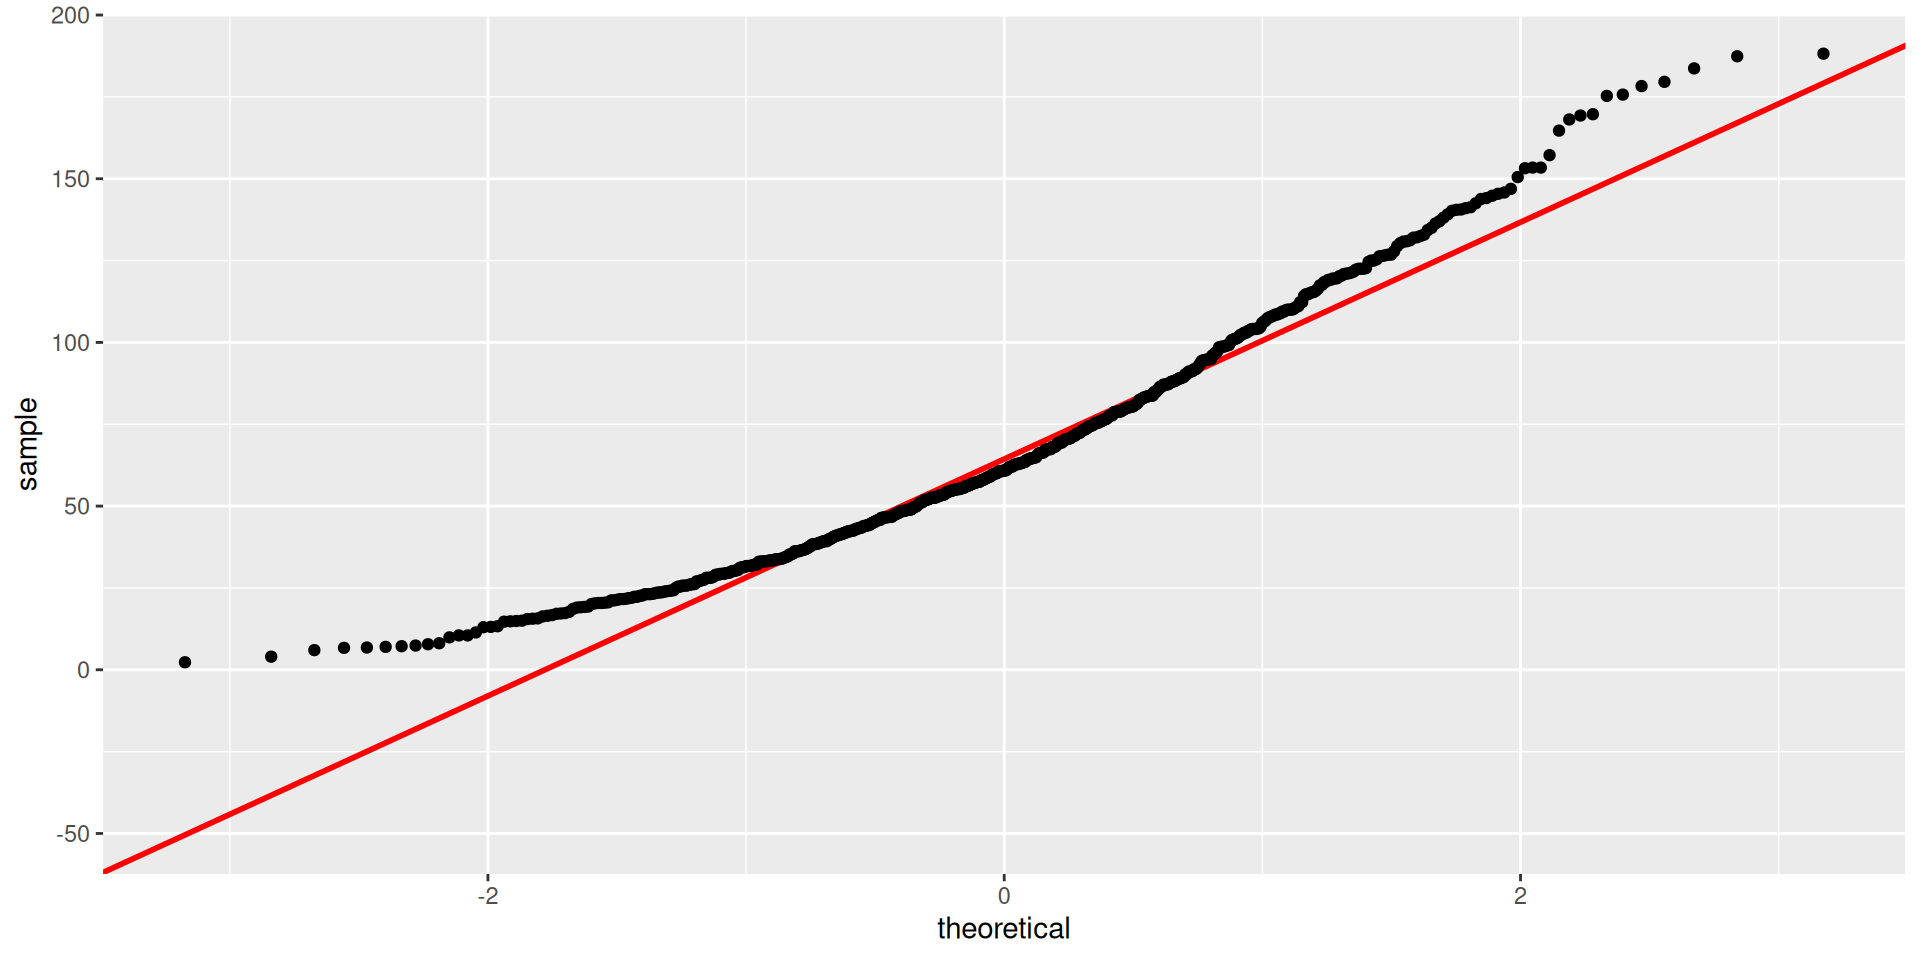
- Normal-Quantil-Plot mit
geom_qq()undgeom_qq_line() - Mapping als Argument in
ggplot()gilt für alle Geoms
Dichtefunktion Niederschläge
ggplot(data = d_ns_m, mapping = aes(x = Niederschlag)) +
  geom_histogram(mapping = aes(y = stat(density)), binwidth = 10, boundary = 0) +
  geom_density(color = "red", linewidth = 1) +
  lims(x = c(-20, 220))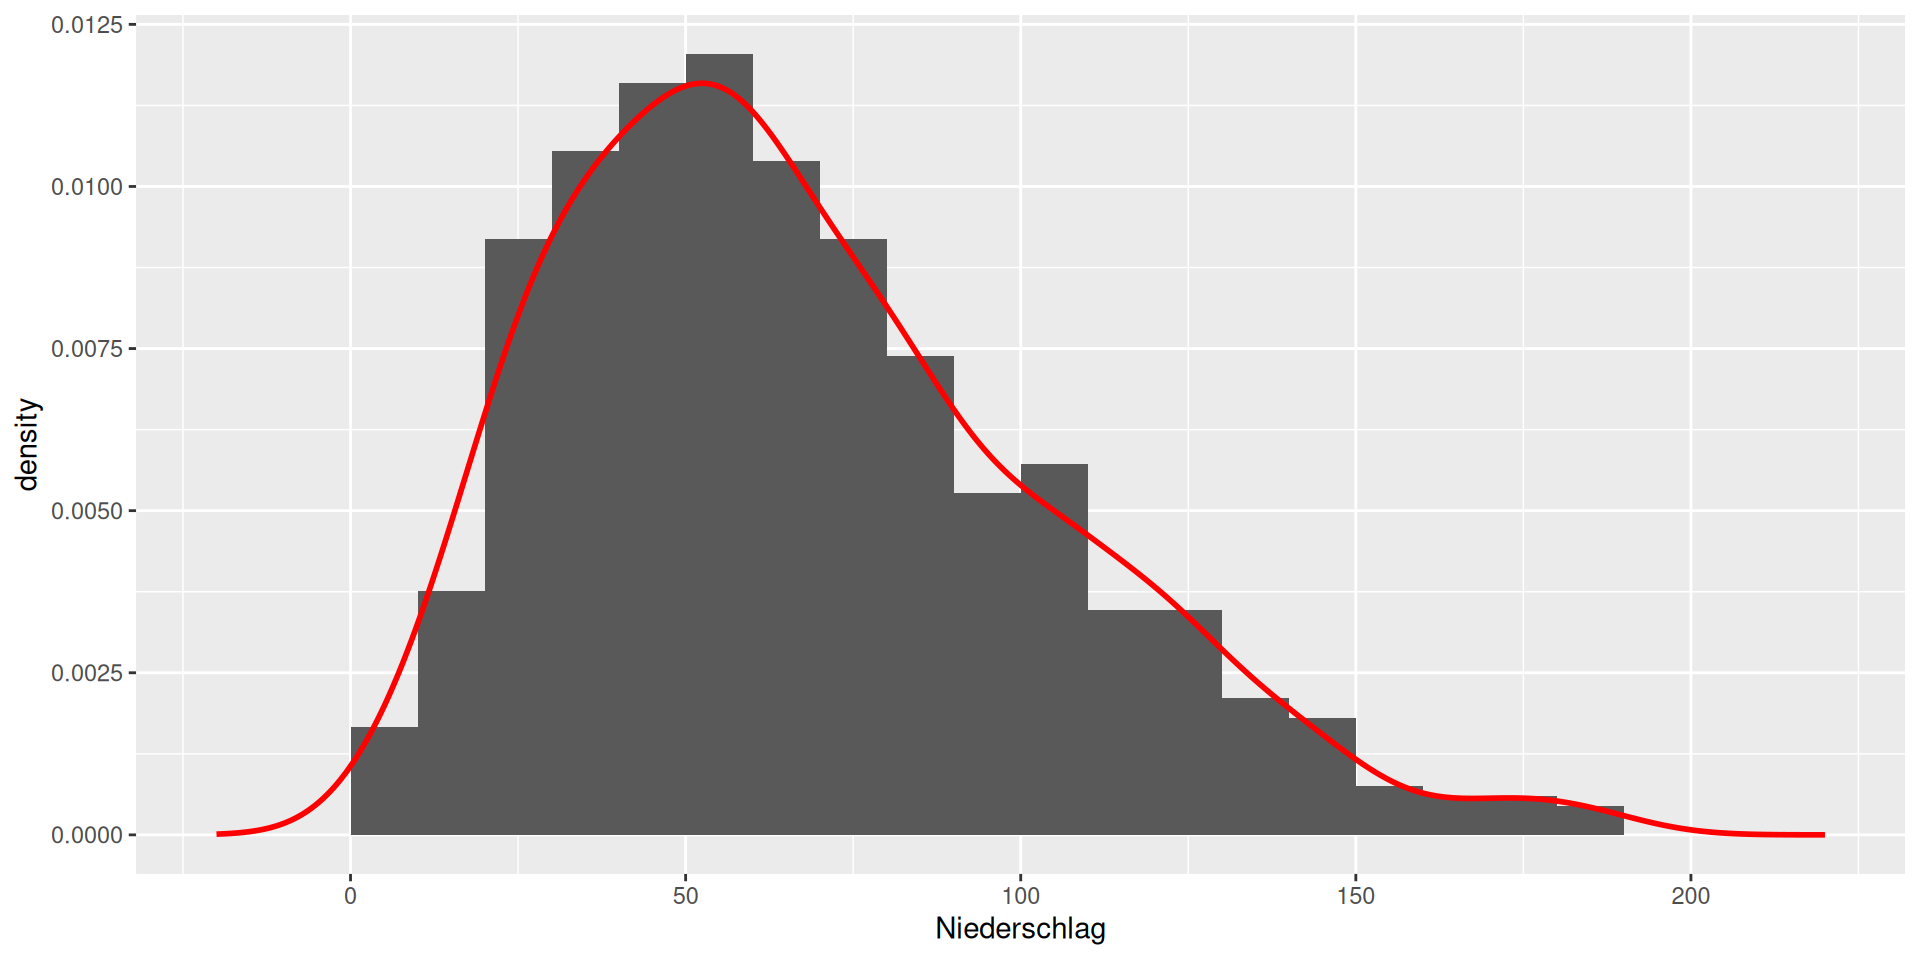
- Approximierte Dichtefunktion
geom_density()
Dichtefunktion Niederschläge
ggplot(data = d_ns_m, mapping = aes(x = Niederschlag)) +
  geom_histogram(mapping = aes(y = stat(density)), binwidth = 10, boundary = 0) +
  geom_density(color = "red", linewidth = 1, fill = "linen", alpha = 0.5) +
  lims(x = c(-20, 220))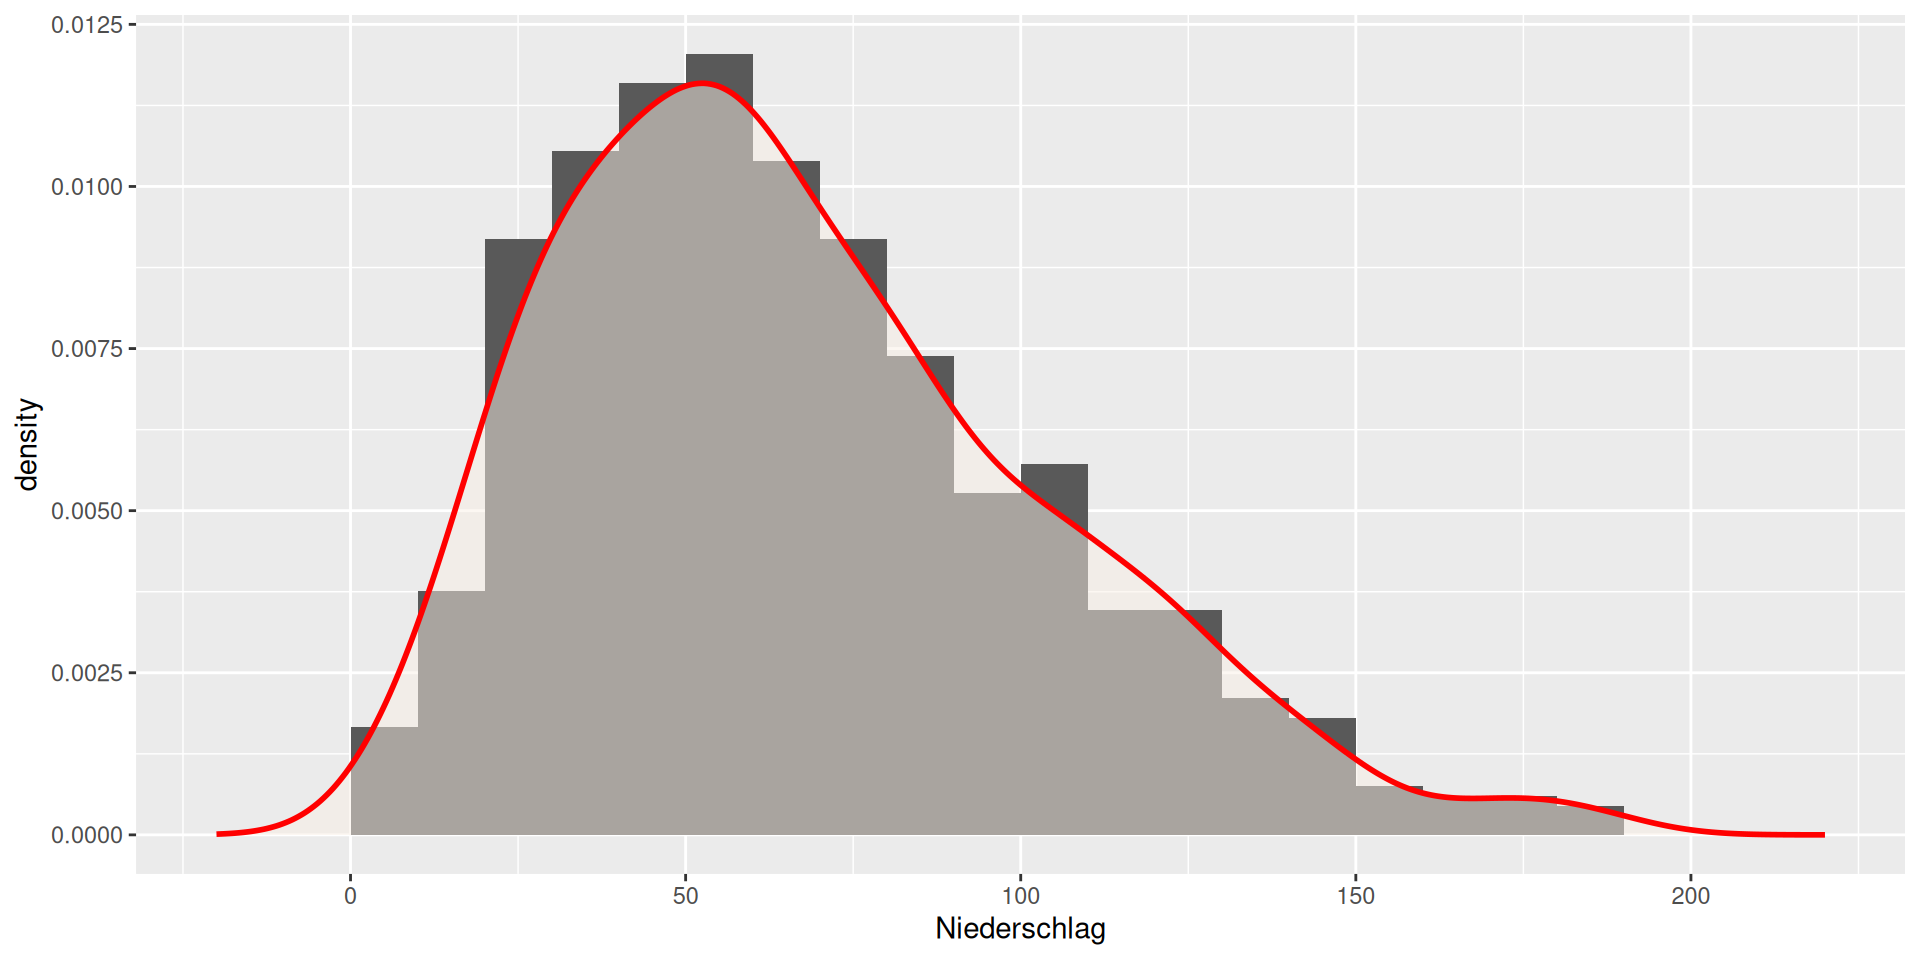
- Füllen mit Farbe
fill = <Farbe>und Transparenzalpha = <Wert>
Dichtefunktion Niederschläge
ggplot(data = d_ns_m, mapping = aes(x = Niederschlag)) +
  geom_histogram(mapping = aes(y = stat(density)), binwidth = 10, boundary = 0) +
  geom_density(bw = 2, linewidth = 1, color = "orange") +
  geom_density(bw = 4, linewidth = 1, color = "blue") +
  geom_density(bw = 8, linewidth = 1, color = "red") +
  lims(x = c(-20, 220))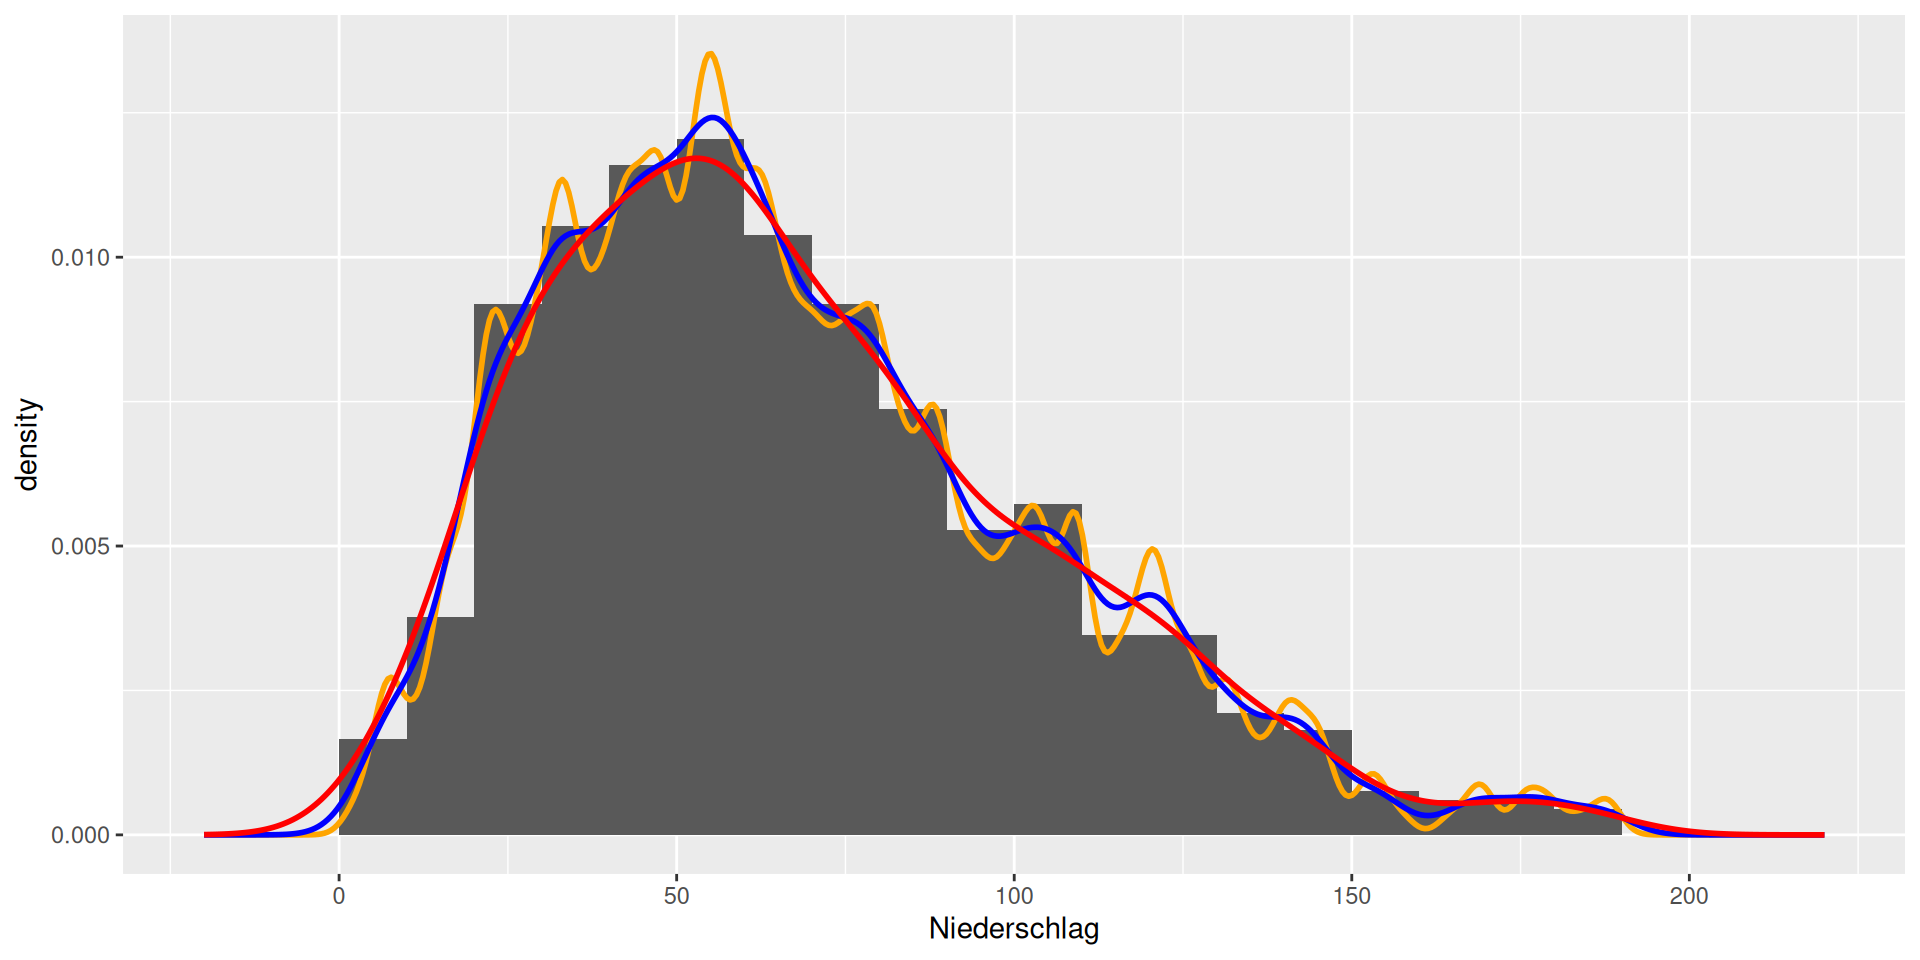
- Argument
bw = <Wert>legt die Breite des Kerns fest (bw = bandwidth) - Je größer
bwumso glatter die Kurve
Dichtefunktion in Monaten
ggplot(data = d_ns_m) +
  geom_density(mapping = aes(x = Niederschlag, fill = Monat), alpha = 0.25)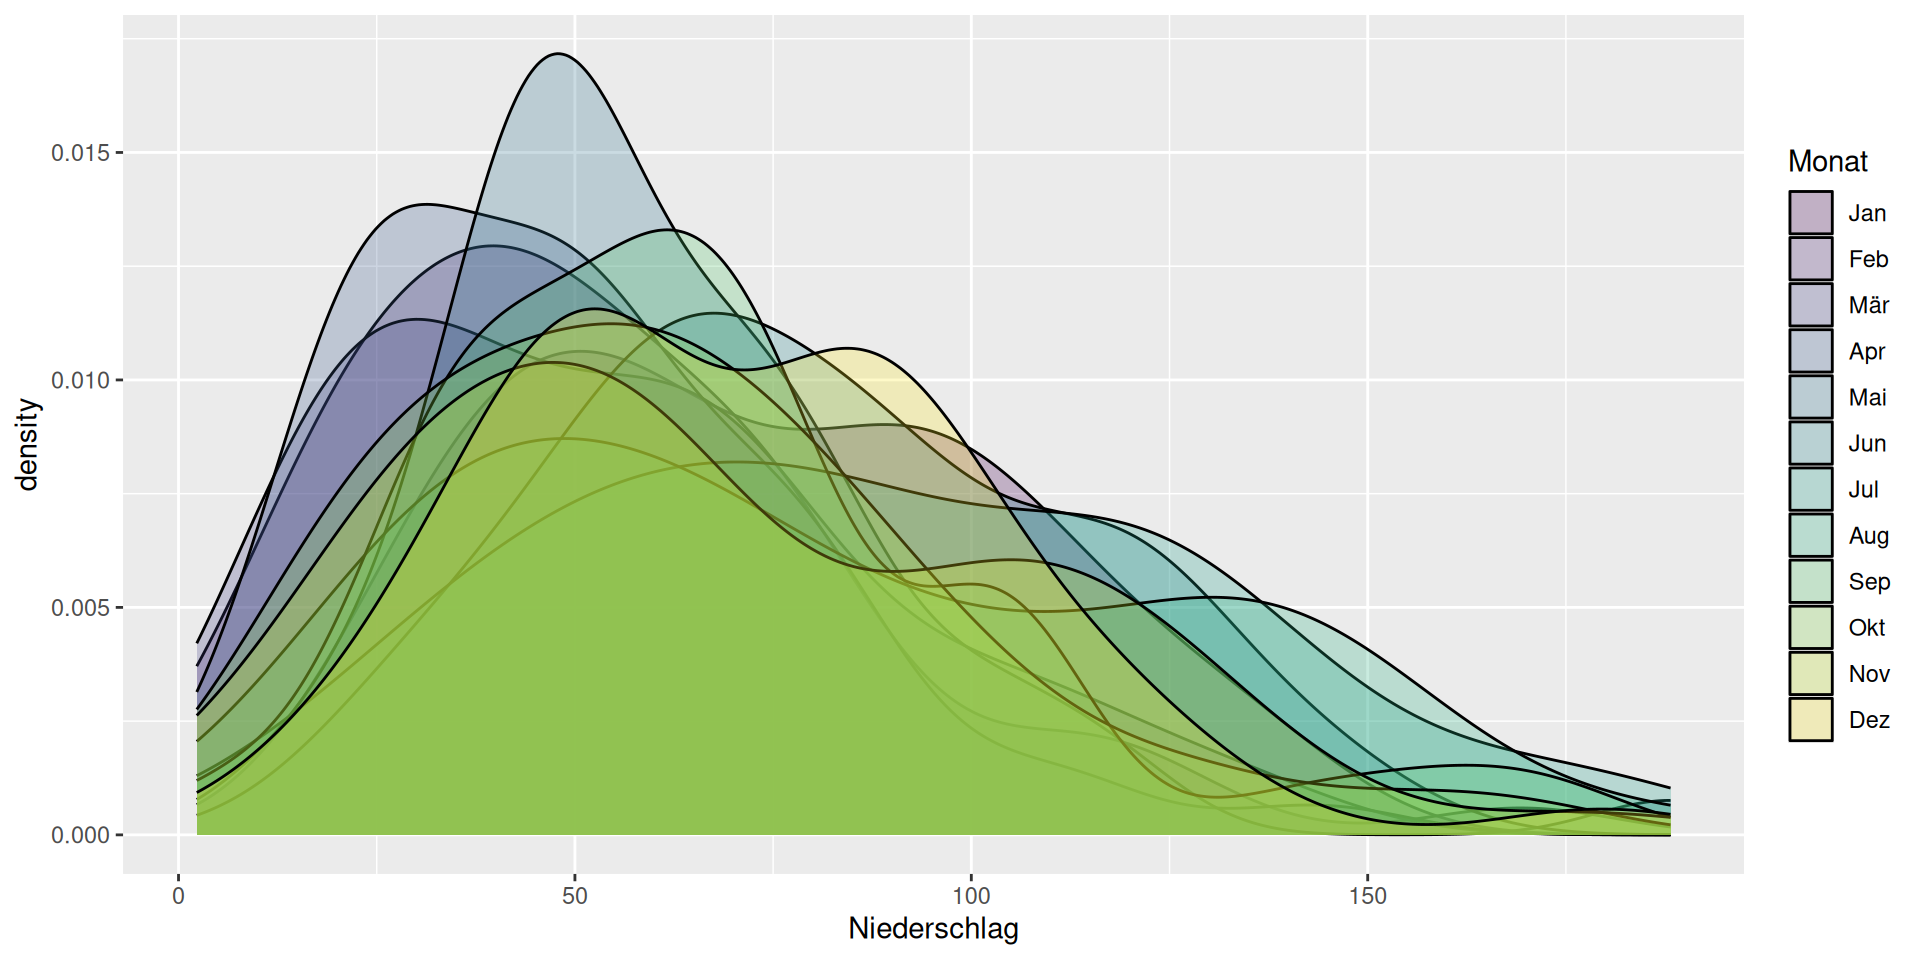
- Füllfarbe nach Monat
- Transparenz wieder mit
alpha
Dichtefunktionen untereinander (Paket ggridges)
ggplot(data = d_ns_m) +
  geom_density_ridges(mapping = aes(x = Niederschlag, y = Monat), bandwidth = 10)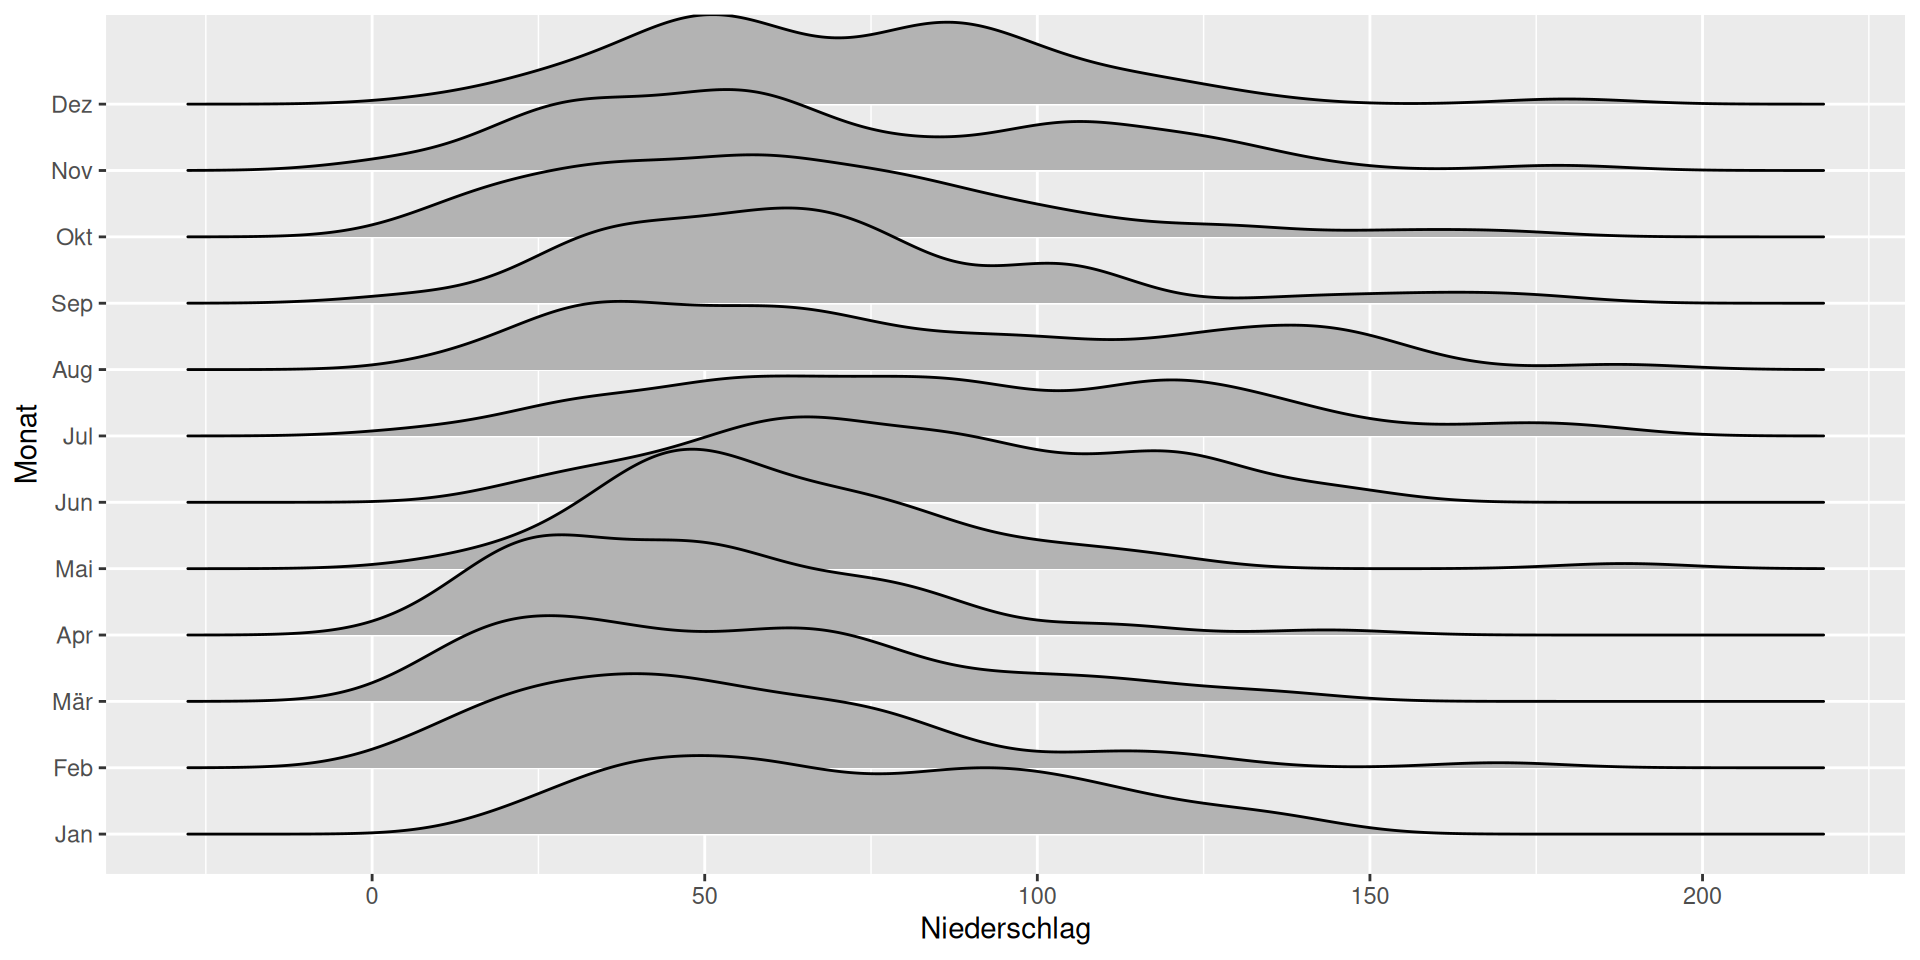
- Geom
geom_density_ridges()wiegeom_density()aber untereinander - Kernbreite mit
bandwidth = <Wert>angeben
Violinenplot
ggplot(data = d_ns_m) +
  geom_violin(mapping = aes(x = 0, y = Niederschlag))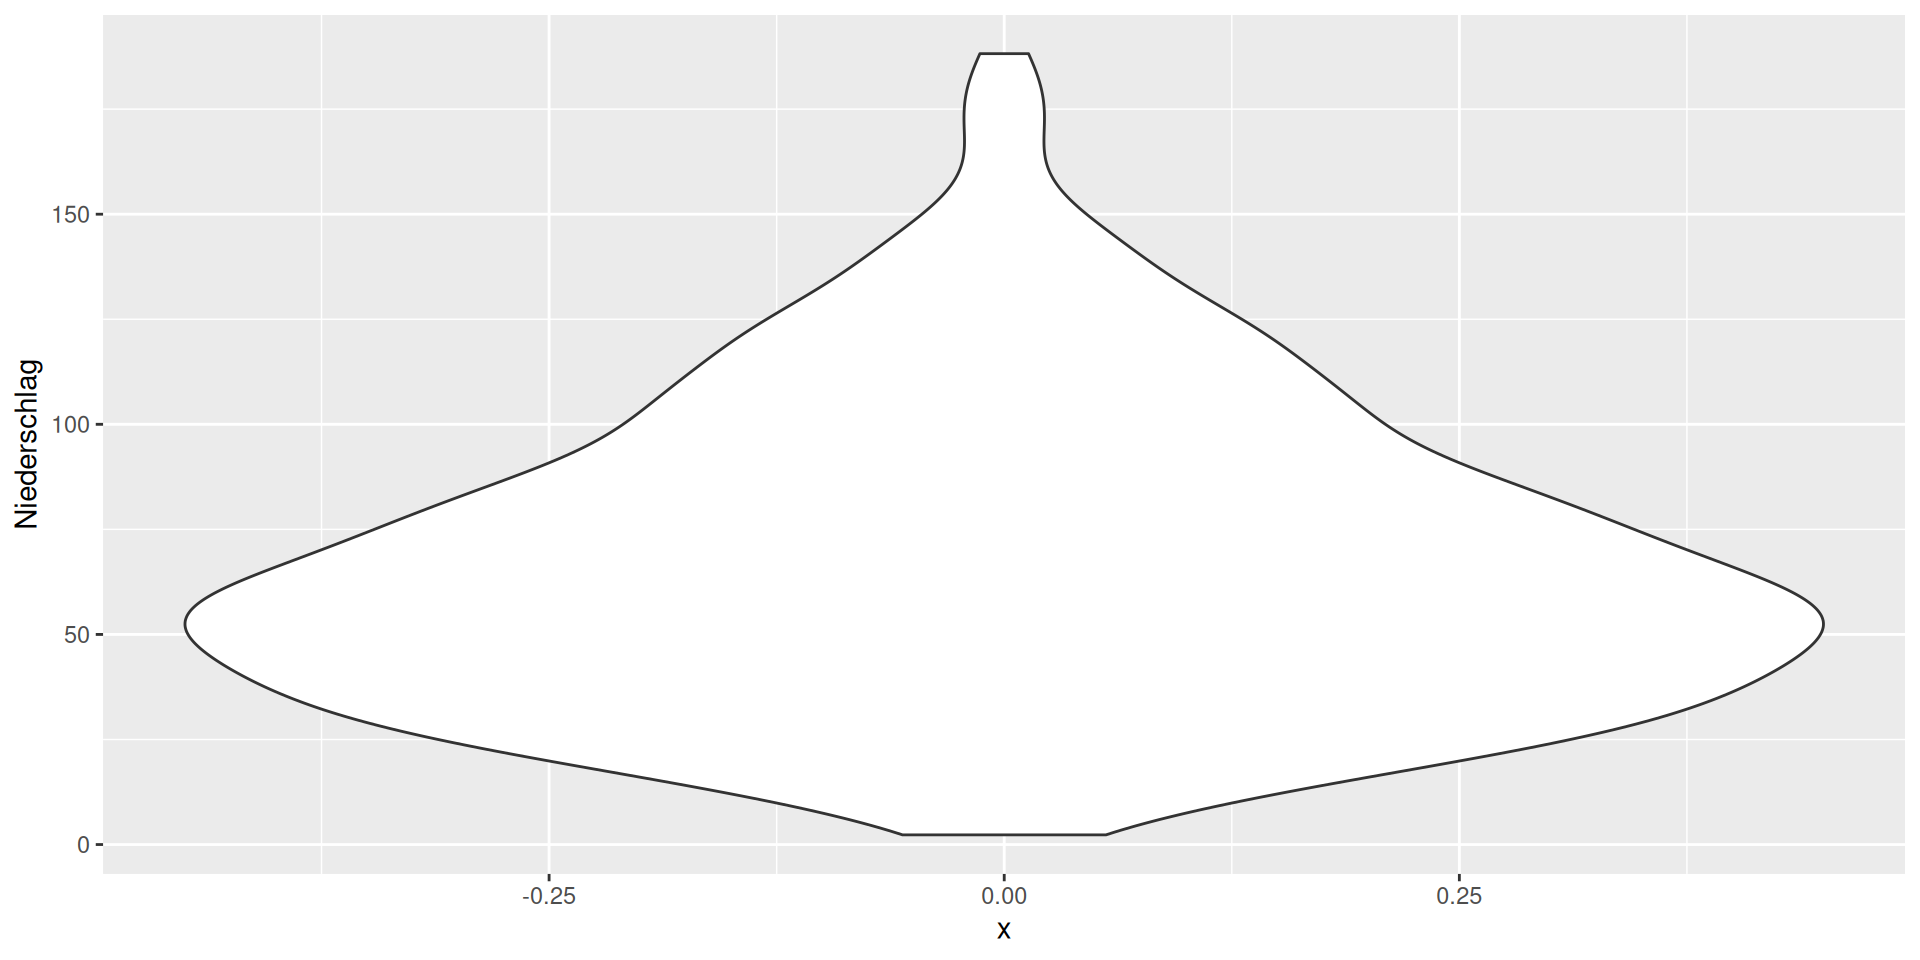
- Ähnlich Boxplot, aber mit Kurven
Violinenplot
ggplot(data = d_ns_m) +
  geom_violin(mapping = aes(x = Monat, y = Niederschlag))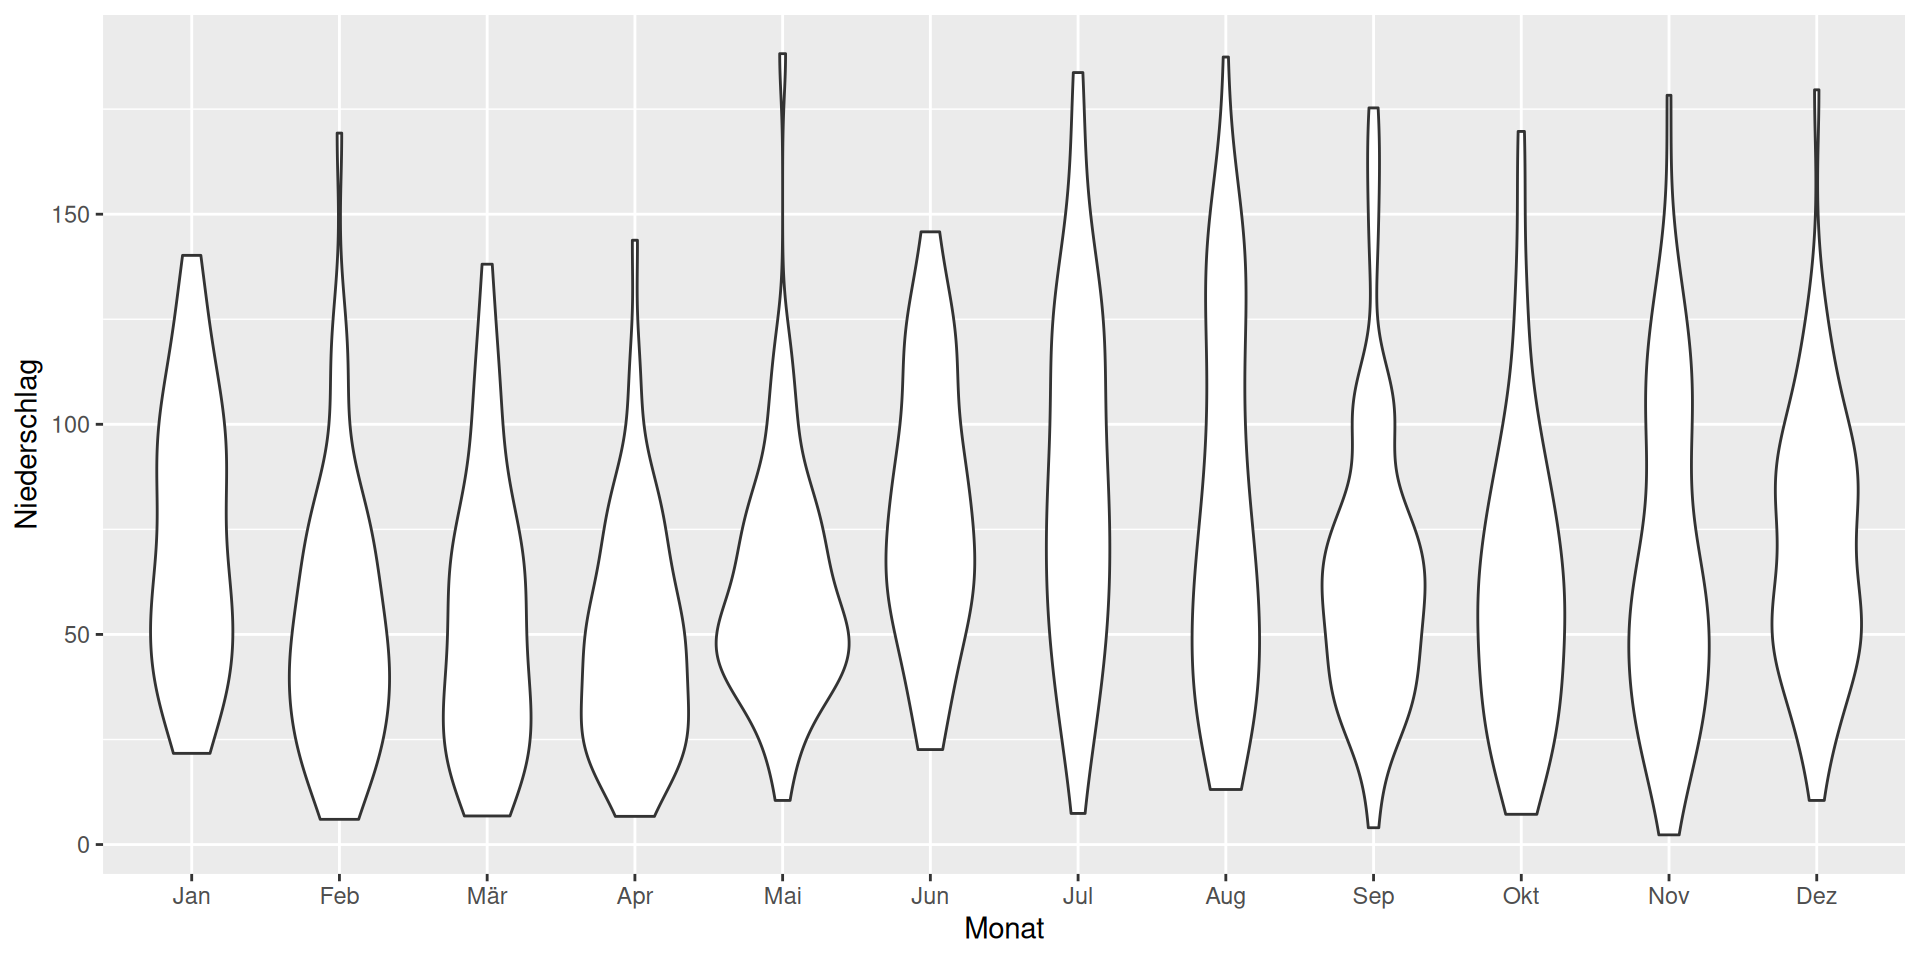
- Charakteristika der Monate ablesbar